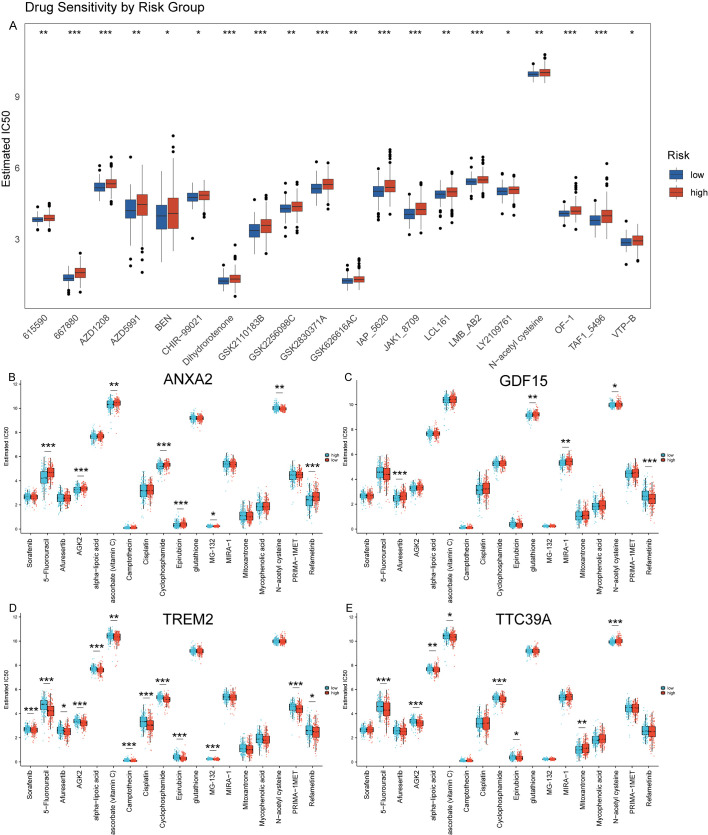
Figure 11.
Prediction of drug sensitivity using GDSC database. (A) Drug sensitivity analysis using the GDSC database comparing the response of high and low-risk groups to various chemotherapeutic agents, demonstrating differential susceptibility to treatment based on risk stratification. (B–E) Analysis of drug sensitivity in HCC based on expression levels of ANXA2, GDF15, TREM2, and TTC39A using the GDSC Database. “*” for P < 0.05; “**” for p < 0.01; “***” for p < 0.001.

