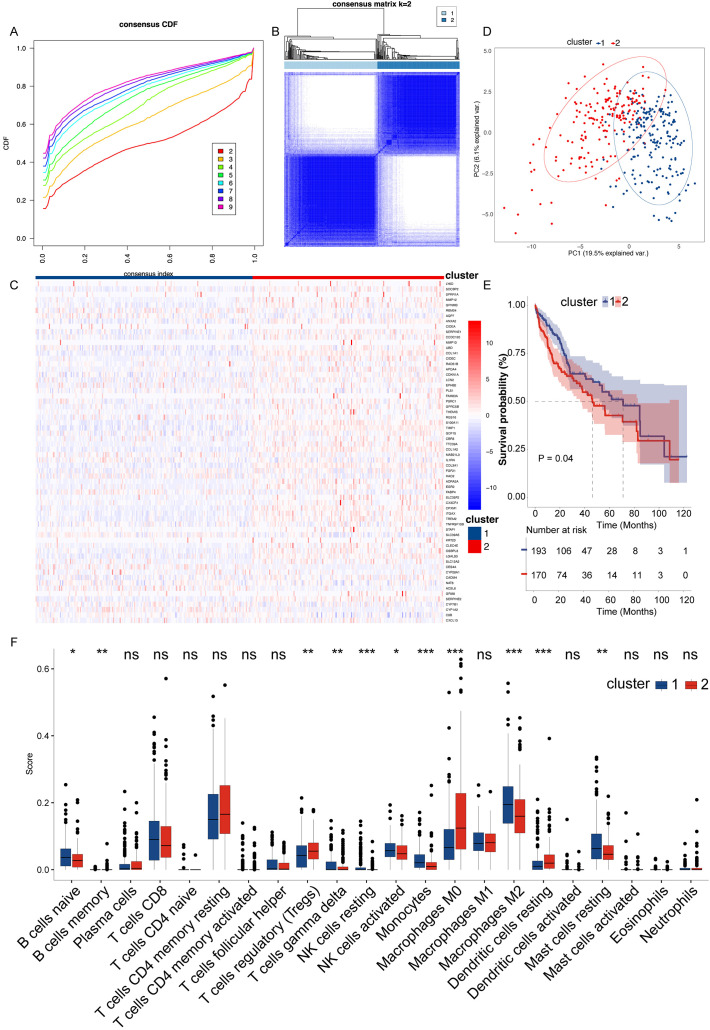
Figure 3.
Integrated analysis of gene expression, clustering, and survival in hepatocellular carcinoma. (A) Cumulative distribution function (CDF) showing the stability of consensus clustering across 2 to 9 potential clusters, indicating the consistency of data partitioning. (B) Consensus matrix for k=2, illustrating the clear separation between the two distinct clusters, highlighted by deep blue (cluster agreement) and white (cluster disagreement) blocks. (C) Heatmap of gene expression across the two clusters. Genes are ordered by differential expression between clusters, with red indicating high expression and blue indicating low expression. (D) PCA plot delineating the spatial separation between the two clusters based on the first two principal components, capturing 19.5% of the variance, which suggests significant molecular heterogeneity. (E) Kaplan-Meier survival curves comparing the overall survival between the two clusters, with shaded areas representing the 95% confidence intervals. Statistical significance is denoted (P = 0.04), suggesting a trend towards different survival outcomes. (F) Box plots showing differential immune cell infiltration between the clusters as analyzed by ssGSEA, with immune cell types plotted along the x-axis and enrichment scores on the y-axis. Statistical significance is indicated above each box plot. “*” for P < 0.05; “**” for p < 0.01; “***” for p < 0.001. ns, not significant.

