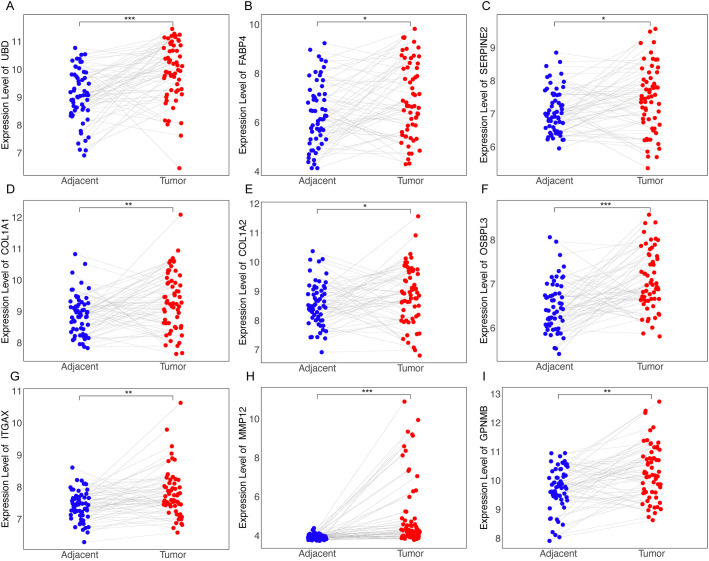
Figure 6.
Differential expression of RRA-selected genes in tumor vs. adjacent non-tumor tissues from dataset GSE64041. Dot plots illustrating the expression levels of genes identified through RRA as being upregulated in tumor tissues compared to adjacent non-tumor tissues as UBD (A), FABP4 (B), SERPINE2 (C), COL1A1 (D), COL1A2 (E), OSBPL3 (F), ITGAX (G), MMP12 (H), GPNMB (I). “*” for P < 0.05; “**” for p < 0.01; “***” for p < 0.001.

