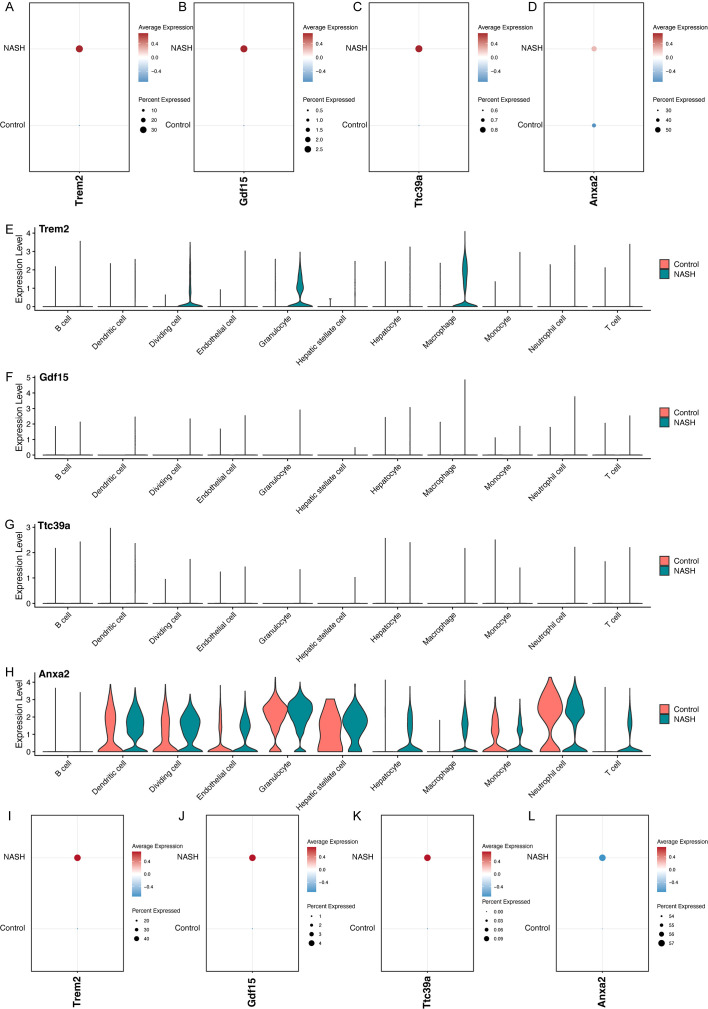
Figure 8.
Analysis of Gene Expression in Control and NASH Samples Across Different Cell Types. Dot plots showing the overall expression levels of Trem2 (A), Gdf15 (B), Ttc39a (C), and Anxa2 (D) in control and NASH samples. Violin plots showing the expression levels of Trem2 (E), Gdf15 (F), Ttc39a (G) and Anxa2 (H) across various cell types in control and NASH. Dot plots showing the expression levels of Trem2 (I), Gdf15 (J), Ttc39a (K), and Anxa2 (L) in macrophage in control and NASH.

