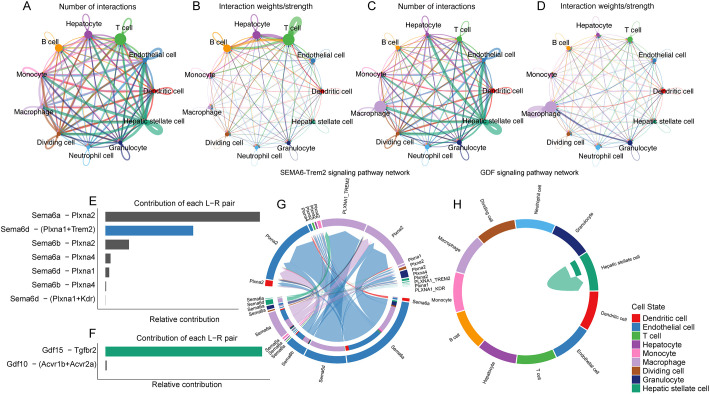
Figure 9.
Cellular communication networks in control and NASH conditions through single-cell transcriptomic analysis of dataset GSE216836. (A) Network diagram showing the number of interactions between various cell types in the control group. Each node represents a cell type, and the thickness of the connecting lines indicates the number of interactions. (B) Network diagram illustrating the interaction strength between different cell types in the control group, with thicker lines representing stronger interactions. (C) Network diagram showing the number of interactions between various cell types in the NASH group. (D) Network diagram illustrating the interaction strength between different cell types in the NASH group, with thicker lines representing stronger interactions. (E) Bar chart showing the relative contribution of different ligand-receptor pairs in the Sema6 signaling pathway. Notably, the interaction between Trem2 and Plxna1 is highlighted. (F) Bar chart detailing the contributions of ligand-receptor pairs in the Gdf signaling pathway, focusing on the interaction between Gdf15 and Tgfbr2. (G) Chord diagram illustrating the SEMA6-Trem2 signaling network across different cell types, highlighting the complexity and connectivity of this pathway. (H) Circular plot showing the distribution of the GDF signaling pathway across various cell types.

