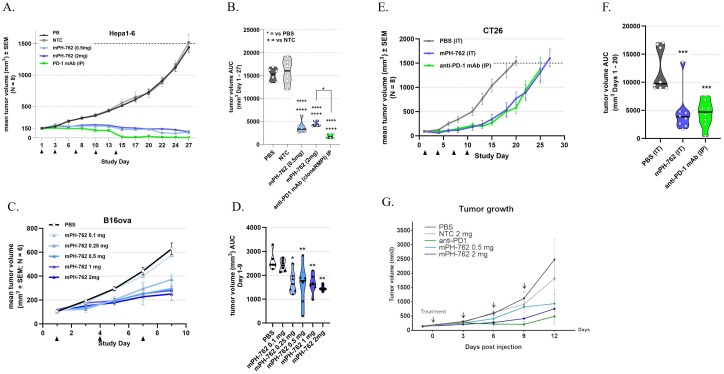
Figure 1.
IT mPH-762 treatment elicits tumor control in a dose-associated manner in multiple syngeneic tumor models. mPH-762 was administered IT q3d as indicated. Anti-PD-1 mAb control was administered IP q3d as indicated. Tumors were measured 3x/week by caliper, and volumes calculated by V = (LxW2)/2. (A, B) Hepa1-6 model. (C, D) B16-OVA model. (E, F) CT26 model. (G) BP model (A, C, E, G) Group mean tumor volume ± SEM (N = as indicated) over time. (B, D, F) Tumor volume area under the curve (AUC) calculated for each animal by trapezoidal transformation over the indicated time period. Violin plots with individual animals and medians are shown. Statistical significance of differences in mean AUC were assessed by one-way ANOVA and Tukey’s or Dunnett’s (F) multiple comparisons post-hoc tests. ****p <0.0001; ***p <0.001; **p <0.01.

