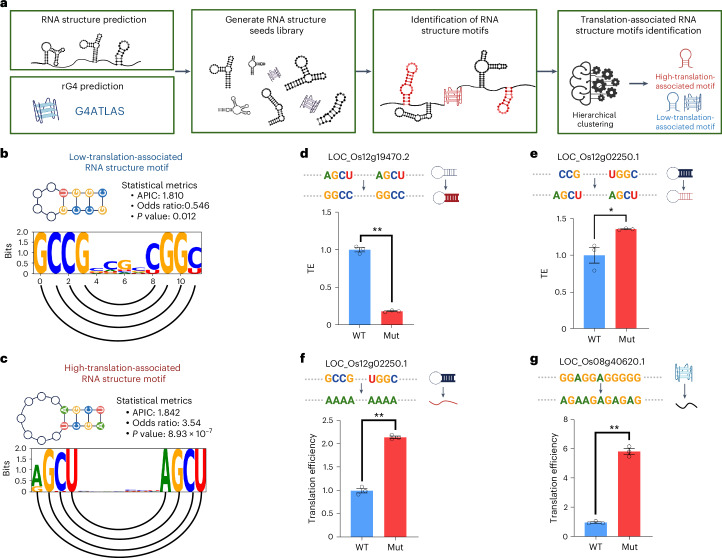
Fig. 4. RNA structure motif identification approach reveals translation-associated RNA structure motifs.
a, Overview of the RNA structure motif identification approach. RNA structures are predicted using RNAfold with a maximum length of 30 nucleotides to obtain the RNA structure seeds. Predicted rG4s were obtained from the G4Atlas database. b,c, Schematic of high-translation-associated RNA structure motifs and low-translation-associated RNA structure motifs. The sequence logos show the information content of each nucleotide, with semicircles connecting the paired bases. The P value is derived from a two-sided Fisher’s exact test. APIC, average positional information content. d–g, Experimental validation of high- and low-translation-associated RNA structure motifs and low-translation-associated rG4. The bar plot represents the translational efficiency of the original (WT) and RNA-structure-mutated (Mut) constructs from the dual-luciferase reporter assay in plants. It represents the change from high-translation-associated RNA structure motifs to low-translation-associated RNA structure motifs (d), the change from low-translation-associated RNA structure motifs to high-translation-associated RNA structure motifs (e), the complete disruption of low-translation-associated RNA structure motifs (f) and the complete disruption of low-translation-associated rG4 (g). P values (d–g) are 9.677 × 10⁻⁶, 0.027, 2.897 × 10⁻⁵ and 2.004 × 10⁻⁵, respectively, obtained using a two-sided Student’s t-test. * indicates P < 0.05, ** indicates P < 0.01, n = 3; error bars indicate the standard error. Panel a was created with BioRender.com.

