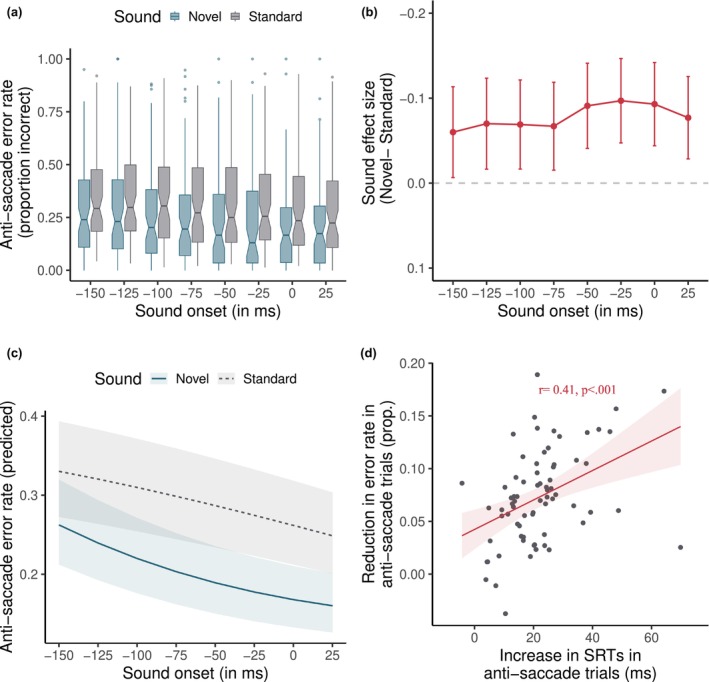
FIGURE 3.

Anti‐saccade errors in the experiment. (a) shows boxplots of the error rate for each sound and delay condition. (b) shows the sound effect size for anti‐saccade error for each delay condition. Error bars show ±1 SE. (c) shows the predicted anti‐saccade error rate from a GLMM model that treats sound onset as a continuous variable and includes both linear and quadratic terms for it. Shading indicates 95% CIs. (d) shows a positive correlation between the reduction in error rate and the size of the novelty distraction effect in SRTs in the anti‐saccade task. In other words, participants with greater saccadic inhibition in SRTs also show a greater reduction in anti‐saccade errors. Dots show the individual effect size for each participant.
