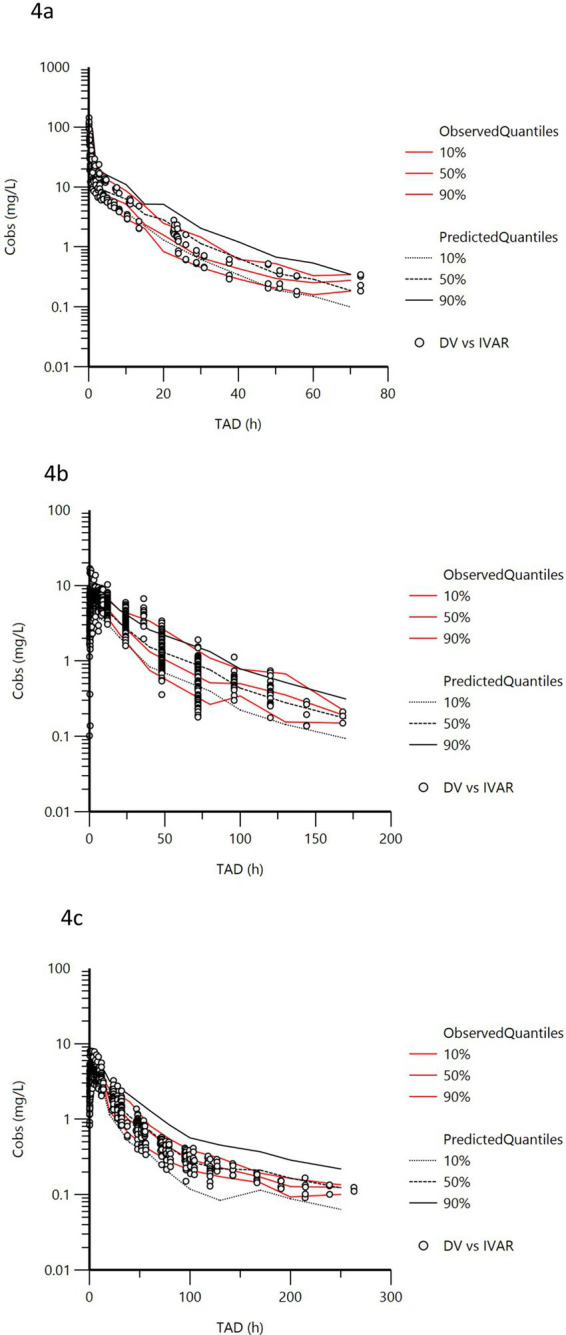
Figure 4.

Visual predictive Check (oxytetracycline). VPCs were obtained for 500 replicates. The observed quantiles (10, 50 and 90%) (red lines) are well superimposed on the corresponding predictive check quantiles (black lines) of the observed data. Theoretically, approximately 20% of data (black symbols) should be outside the plotted quantiles. X axis = hours and Y axis = mg/L. (a) intravenous administration, (b) intramuscular administration in adult cows, (c) intramuscular administration in claves (< 0.5 years old).
