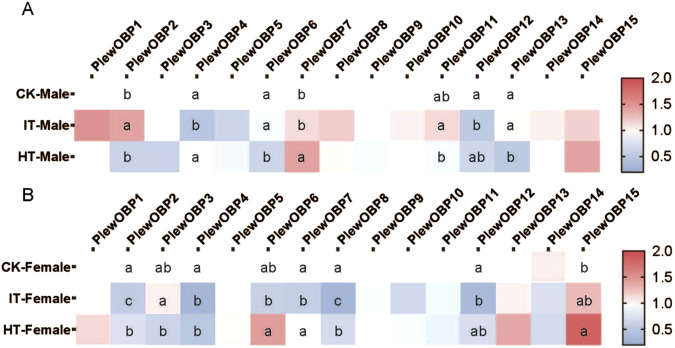
FIGURE 6.
Heat map of expression profiles of PlewOBPs after odor exposure treatment. (A, B) The expression levels of PlewOBPs from male and female Picromerus lewisi, respectively. The results were analyzed using one-way ANOVA with Tukey’s HSD post hoc test. The absence of lowercase letter indicates no significant difference.

