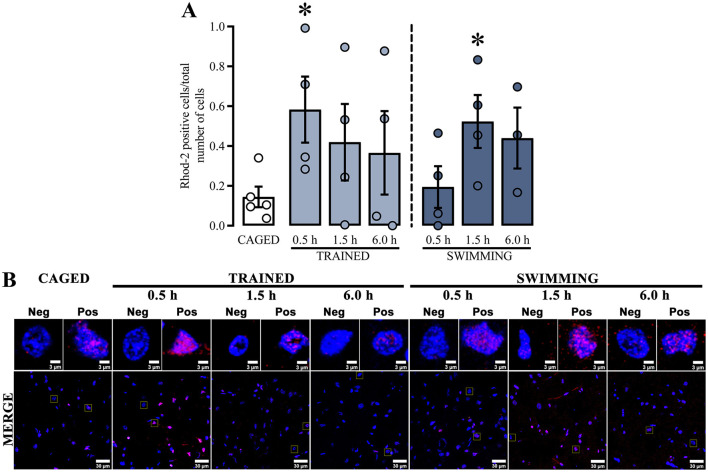
Figure 4.
(A) Ratio Rhod-2-positive cells; a t-test indicated statistical differences compare to the CAGED group; (*) p < 0.05. n = 3–5. Data represent mean ± SEM, with small circles representing individual values. (B) Representative micrographs of the dorsal striatum of experimental and control groups, Rhod-2 fluorescence in red and the nuclei in blue.

