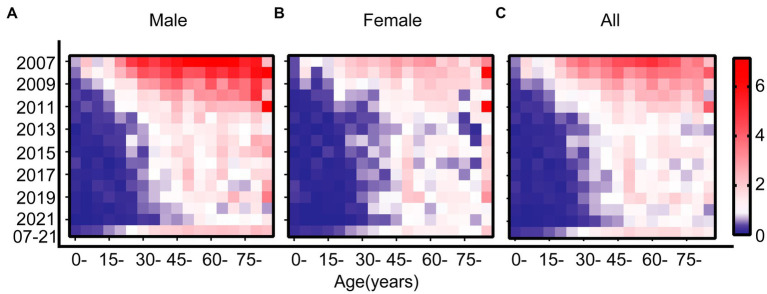
Figure 2.
Lexis diagram of Hepatitis A incidence rates in Jiangsu province, China, from 2007 to 2021, stratified by year of diagnosis and age at diagnosis. (A) Males. (B) Females. (C) Overall. In each diagram, blue represents lower incidence rates, and red represents higher incidence rates. The scale is consistent across all panels. For each panel: rows indicate the incidence rates across specific age groups within a given calendar year; columns indicate the incidence rates within specific age groups across different calendar years.

