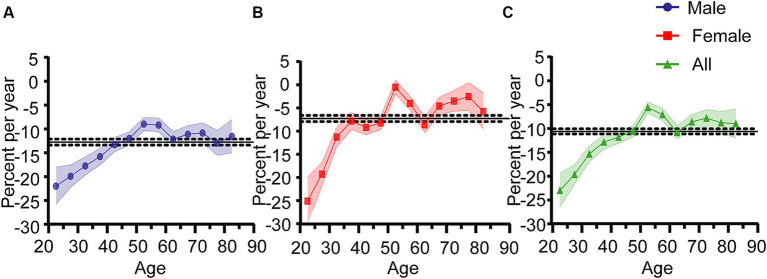
Figure 4.
Net drift and local drift of Hepatitis A incidence rates in Jiangsu Province, China, from 2007 to 2021. (A) Males. (B) Females. (C) Overall. The horizontal black solid line represents the net drift value, and the black dashed lines correspond to the 95% confidence intervals (CI). The colored solid lines represent the local drift values, with the colored bands showing the 95% CI.

