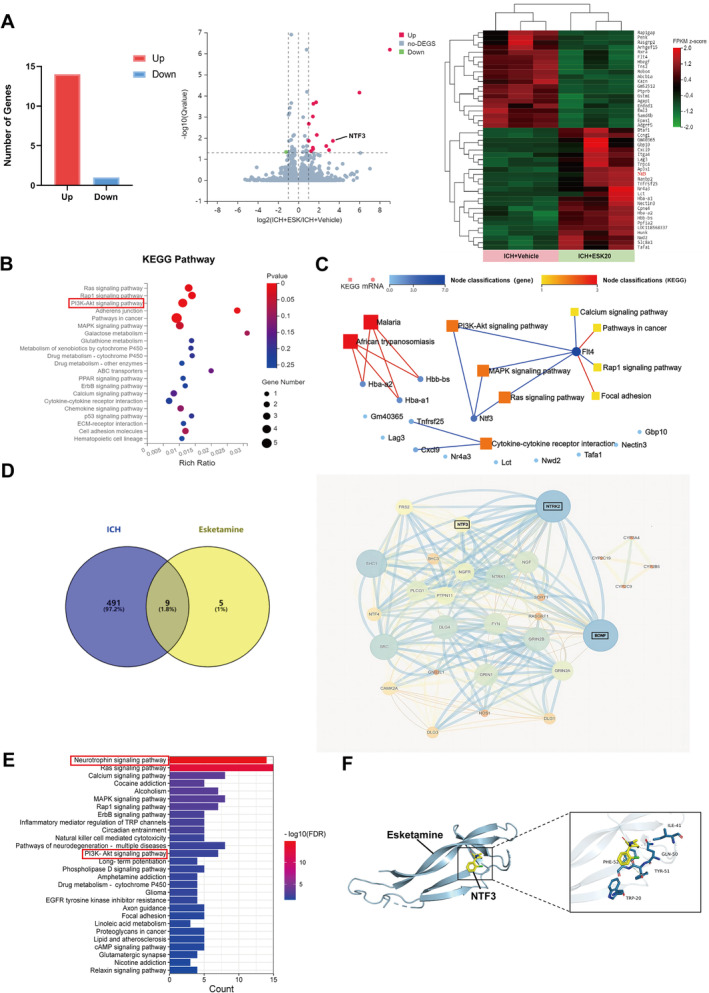
FIGURE 3.

ESK treatment alters the gene transcription profile induced by ICH, with network pharmacology predicting possible target pathway interactions involved. (A) Histogram of differentially expressed genes (DEGs) comparing ICH + ESK20 vs. ICH + vehicle groups). Volcano plots show selected pairwise comparisons. DEGs were identified based on log2 |fold‐change| > 1 and Q‐value < 0.05. Heatmap of the cluster analysis illustrates transcript expression levels of DEGs in ICH groups on Day 3 after treatment with ESK or vehicle. The color scale indicates relative expression levels: red represents level above the mean, and green represents levels below the mean. (B) KEGG pathway enrichment bubble map, where a larger −log10 (p‐value) indicates a greater degree of enrichment. (C) Network of significantly enriched KEGG pathways altered by ESK treatment. Squares represent related pathways, circles represent DEGs, and darker colors indicate stronger correlations. (D) Venn diagram showing putative targets of ESK and ICH‐related genes, with a protein–protein interaction network illustrating interactions among target genes. Circle size indicates the target protein degree value. (E) Pathway enrichment analysis. (F) Molecular docking analysis predicts the binding of ESK to NTF3, showing hydrophobic interactions and π–π stacking with NTF3 residues that form a stable spatial conformation.
