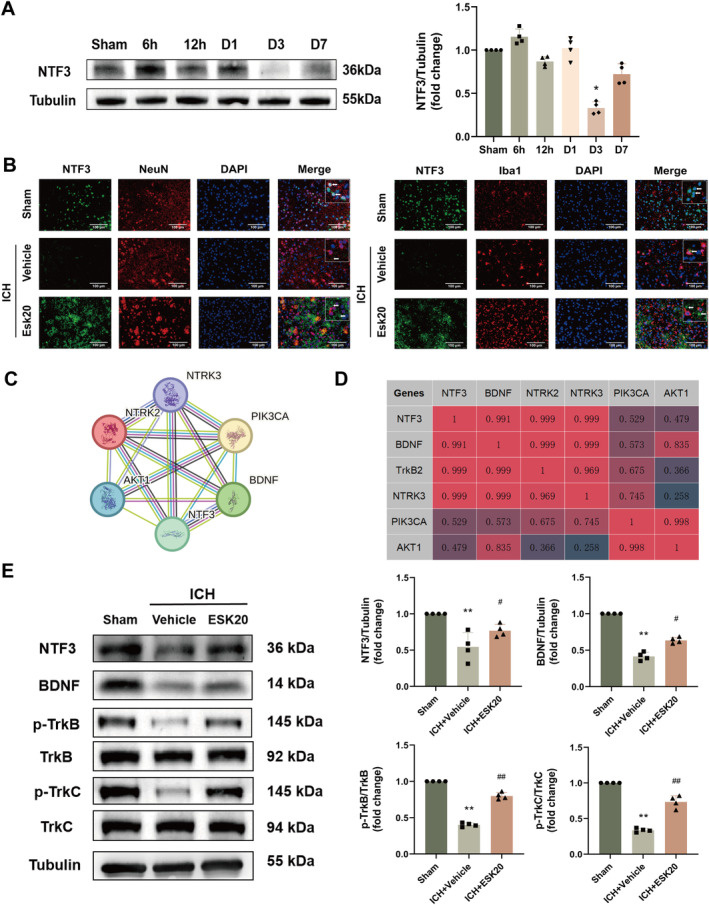
FIGURE 4.

Time course of NTF3 protein levels and cellular localization after ICH. (A) Representative Western blot results and quantitative analyses of temporal changes in NTF3 expression in the ipsilateral hemisphere after ICH (n = 4). *p < 0.01 versus sham. (B) Representative images of double immunofluorescence staining showing colocalization of NTF3 (green) with neurons (NeuN, red) or microglia (Iba1, red) in the perihematomal region of ICH + vehicle and ICH + ESK20 groups, and the corresponding region in the sham group, at 72 h after ICH (n = 3). Scale bar: 100 μm. (C) NTF3‐related protein interaction network map, with circles representing proteins and lines, indicating verified interactions by different methods. (D) Correlation analysis between proteins. Scores range from 0 to 1, with higher scores associated with greater correlations. (E) Representative Western blot bands and quantitative analyses of the expression of key proteins associated with NTF3 function (n = 4). **p < 0.01 versus sham; # p < 0.05, ## p < 0.01 versus ICH + vehicle.
