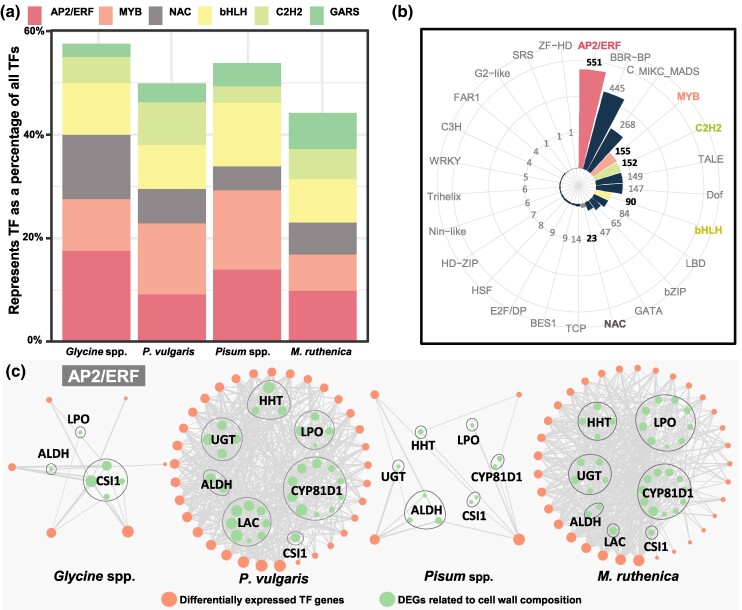
Fig. 4.
Identification of potential key regulators of pod dehiscence in legumes. a) Percentage of Top6 representative TFs. The proportion of each TF family to the total differentially expressed TF genes was calculated in each species. b) Statistics on the number of promoter binding sites. Important differentially expressed TF genes are highlighted in bold. c) Expression correlation between AP2/ERF-like TF genes and structural genes. The circle size indicates the count of the genes associated with its expression. The line width represents the correlation level. LPO, lactoperoxidase; HHT, ω-hydroxypalmitate O-feruloyl transferase; UGT, UDP-glycosyltransferase; ALDH, aldehyde dehydrogenase; CYP81D1, Cytochrome P450/isoflavone 2′-hydroxylase; LAC, laccase; CSI1, cellulose synthase-interactive protein 1. All correlations are significant at P < 0.05.

