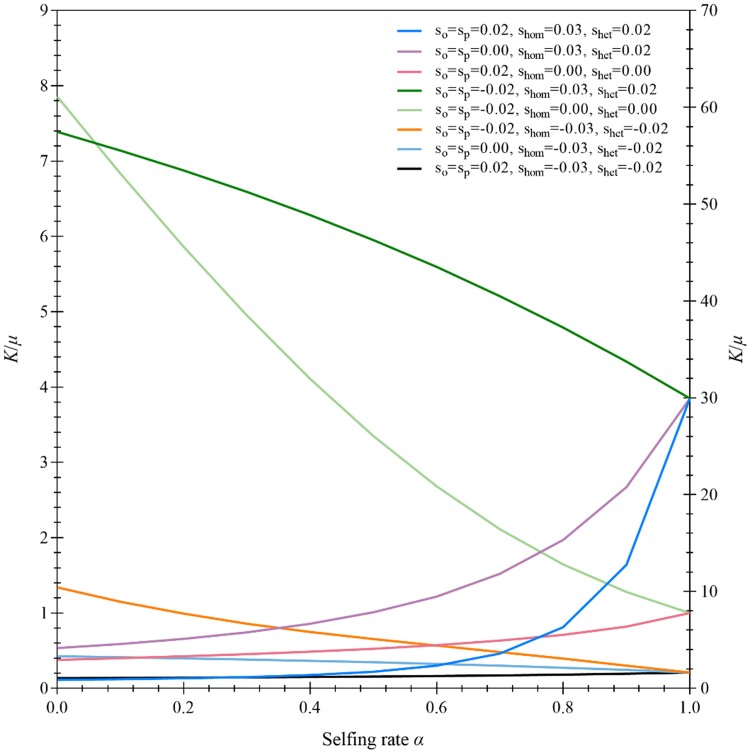
Fig. 5.
Examples of the ratio under different cases of gametophytic and sporophytic selection. The results are obtained from equation (10). Selection coefficients in each case are indicated in the figure, with a commonly used parameter of the effective population size . The cases with the first y-axis are the gametophytic selection only (, , for the deleterious mutant allele; , , for the favorable mutant allele), the sporophytic selection against the deleterious mutant allele (, , ), the antagonistic selection (, , ), and the synergistic selection against the deleterious mutant allele (, , ). The cases with the second y-axis are the antagonistic selection (, , ), the sporophytic selection for the favorable mutant allele (, , ), and the synergistic selection for the favorable mutant allele (, , ).

