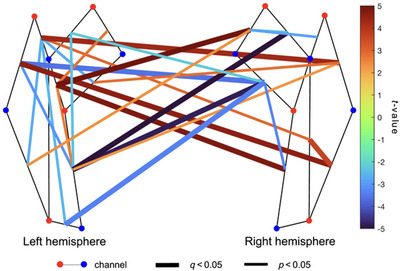
FIGURE 4.

Group regression analysis demonstrating gestational age–related patterns in spontaneous functional connectivity (sFC) (n = 41). Channel‐pairs displaying a significant positive or negative effect of gestational age on sFC are depicted in red and blue lines, respectively. The false discovery rate (FDR) was used to correct for multiple comparisons. Channel‐pairs that exhibited significant connectivity after FDR correction are drawn as thick lines, whereas channel‐pairs with significant connectivity before FDR correction are denoted with thin lines. The color of the lines represents the t‐value calculated for that channel‐pair's connectivity. Channel‐pairs that had less than 10 datapoints and those that were not significant have been omitted to increase clarity.
