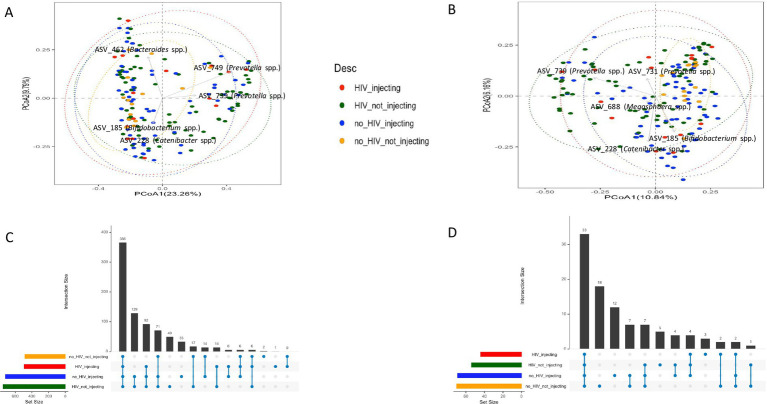
Figure 5.
PCoA plots (Bray-Curtis distances) comparing beta diversity for the (A) core ASVs among the four groups of subjects based on HIV and injection status (B) beta diversity among the four groups of subjects after removing the 37 common core ASVs. UpSet plots depict (C) the number of shared ASVs across the different groups (D) number of shared core ASVs across the different groups.

