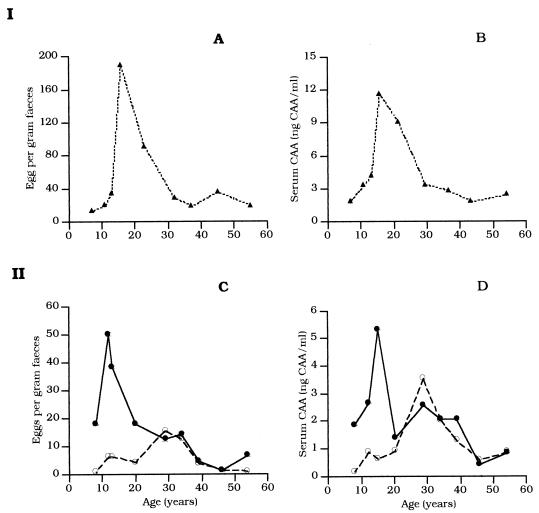
FIG. 1.
Intensities of infection by age. (I) Established cohort. (A) Geometric mean EPG of the stool survey of November 1993 to January 1994. (B) Geometric mean CAA levels in the bleed of March 1994. (II) Immigrant cohort. (C) Geometric mean EPG of the stool surveys of May 1993 (○) and November 1994 (●) (D) Geometric mean CAA levels in the bleeds of May to November 1993 (○) and August to September 1995 (●).

