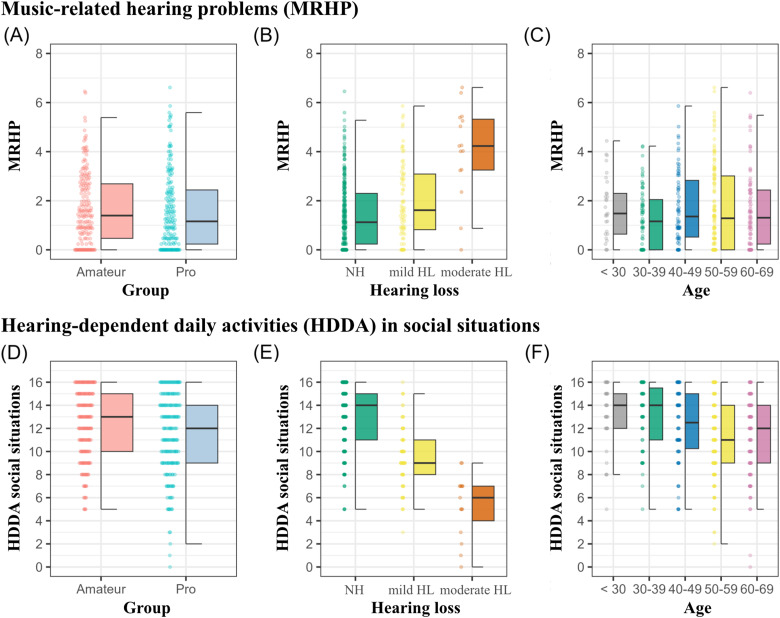
Figure 3.
Amateur (pale red) and professional musicians (light blue) scores for the MRHP scale (higher scores equals more severe problems) and the HDDA (lower scores equals more severe problems). Panel A and D compare MRHP and HDDA in social situations scores between amateur and professional musicians. Panels B and E categorize MRHP and HDDA in social interactions by HL severity (NH, mild HL, at least moderate HL). Panels C and F illustrate MRHP and HDDA in social interactions across age cohorts. Here and in the following, boxplots represent the median and interquartile ranges of scores on the right side and individual responses on the left and NA values are excluded.

