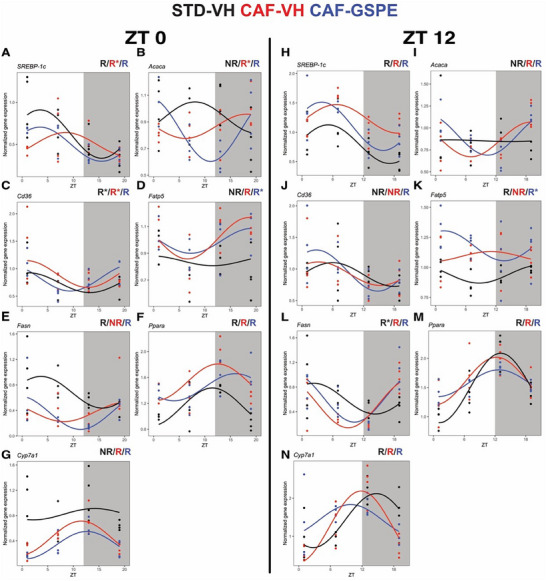
FIGURE 3.

Diurnal gene expression profiles of key genes involved in lipid and bile acid metabolism. Rats were fed a STD or CAF diet and received a daily dosage of vehicle or GSPE at the rest phase (ZT0) (A–G) or at the resting phase (ZT12) (H–N). Rhythm parameter determination and comparison were performed using CircaCompare. R/NR indicates significant/non‐significant rhythmicity (p < 0.05). R* shows a tendency of rhythmicity (p < 0.1). N = 3–4/group at each time point.
