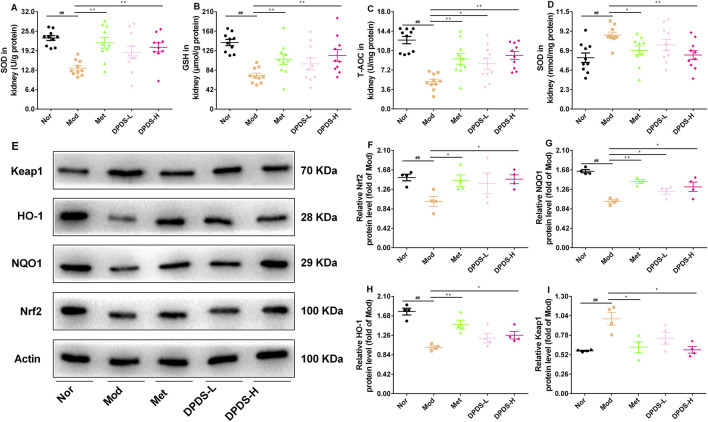
FIGURE 4.
DPDS intervention extenuated oxidative stress damage in kidney of the DKD rats (means ± SEM). (A) SOD activities in kidney (n = 10). (B) GSH levels in kidney (n = 10). (C) T-AOC activities in kidney (n = 10). (D) MDA levels in kidney (n = 10). (E) Representative images of Western blot (n = 4). (F) The relative density analysis of Nrf2 (n = 4). (G) The relative density analysis of NQO-1 (n = 4). (H) The relative density analysis of HO-1 (n = 4). (I) The relative density analysis of Keap1 (n = 4). # p < 0.05; ## p < 0.01 vs. Mod group; *p < 0.05; **p < 0.01 vs. Mod group.

