
FIGURE 5.
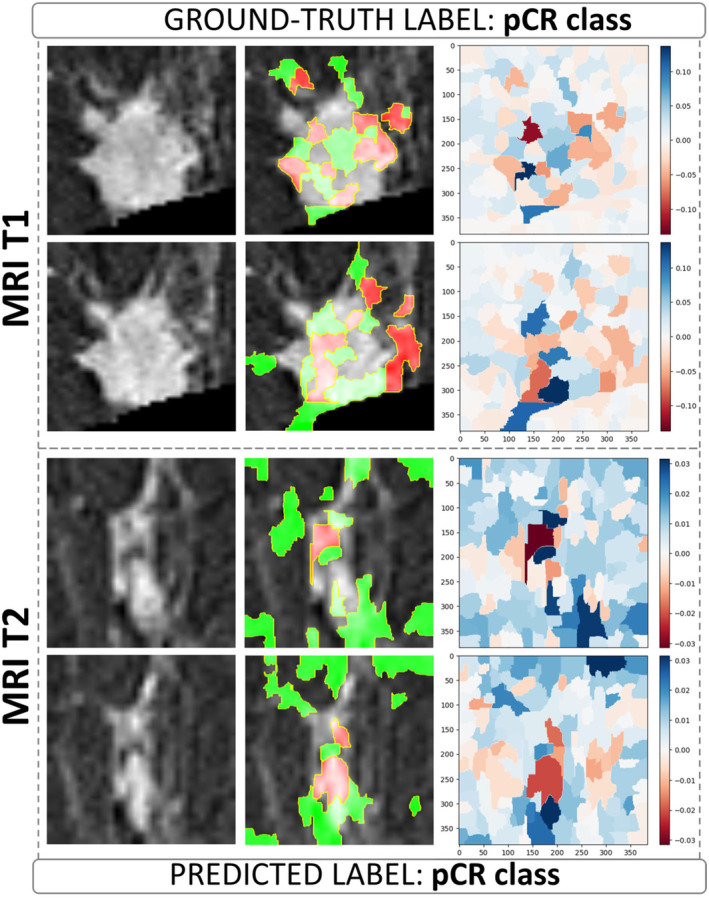
Visualization of LIME superpixels in positive and negative regions applied to two BROI slices from a pCR patient in our institute's cohort, correctly classified by both the MRI T1 and MRI T2 models utilizing a transfer learning module based on the ViT architecture. The left panels show the raw slices. The central panels depict the raw slices overlaid by the most contributing superpixels, where the red color highlights the negatively contributing superpixels to the assignment to pCR class, whereas the green represents otherwise. The right panels represent heatmaps where color intensity is a measure of importance of all the superpixels generated on the raw slices (blue for a positive contribution and red for a negative contribution).