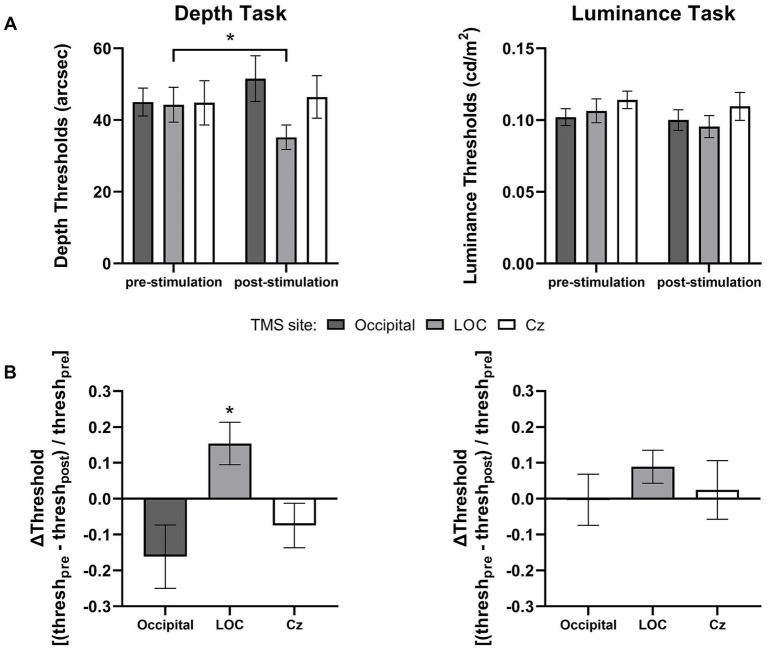
Figure 3.
Stimulation-induced changes in task performance. (A) Mean thresholds for the depth and luminance discrimination tasks before and after stimulation over occipital cortex (n = 17), LOC (n = 18), and Cz (n = 17). (B) The data are re-presented as normalized changes in pre-stimulation versus post-stimulation thresholds (i.e., pre-post/pre) in the depth and luminance tasks. Error bars represent ±1 SEM. *p < 0.0167.

