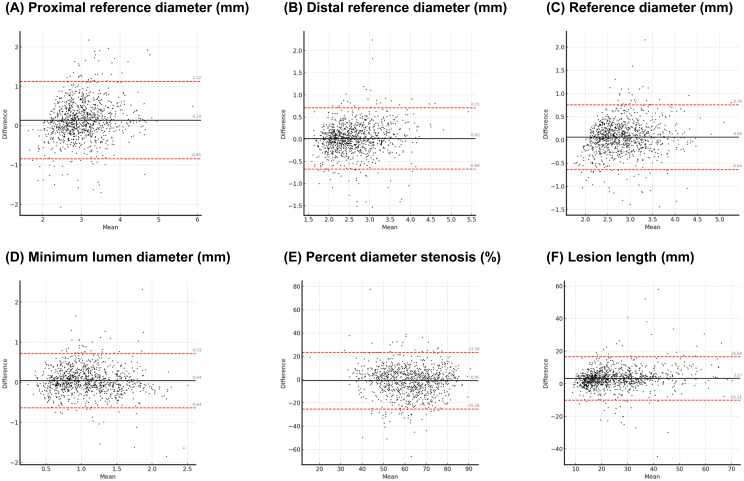
Figure 3.
Bland-Altman plot between AI-QCA and manual QCA (phase 2). The points are distributed around the central line (black solid line) and fall within the limits of agreement (red dashed lines), indicating a high concordance between the two methods. AI-QCA, artificial intelligence-based quantitative coronary angiography; QCA, quantitative coronary angiography.

