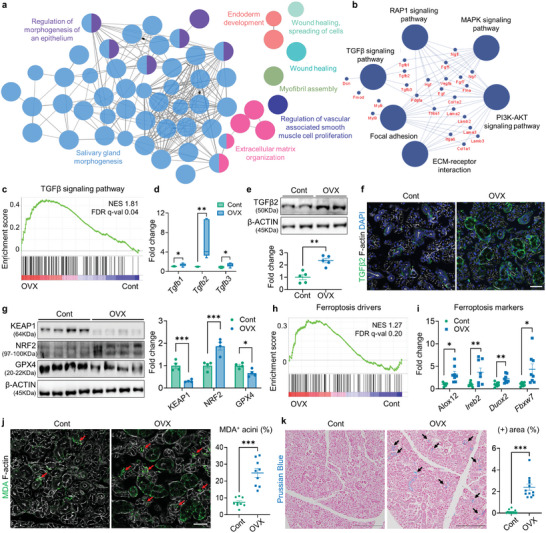
Figure 2.

Transcriptome profiling reveals enrichment of TGFβ signaling and ferroptosis pathways in OVX‐SG. a,b) Visualization of functionally grouped networks via ClueGO, showing enriched GO‐BP terms (a) and KEGG pathways (b) within the Top three upregulated modules of OVX‐SGs. Hub genes shared in KEGG pathways are indicated. c) GSEA of Cont‐ and OVX‐SGs using a TGFβ signaling pathway gene signature extracted from Wiki Pathway. d) Comparison of Tgfb1‐3 mRNA levels between Cont‐ and OVX‐SGs, conducted by qPCR. e) Analysis of TGFβ2 protein levels in Cont‐ and OVX‐SGs by Western blot (WB). f) Representative immunofluorescence images depicting TGFβ2 expression in the SG. g) Assessment of redox‐regulating protein levels in the SGs by WB. h) GSEA illustrating enrichment of ferroptosis drivers between Cont‐ and OVX‐SGs. i) Evaluation of relative mRNA expression levels of ferroptosis marker genes using qPCR. j) Detection and quantification of MDA+ acini (red arrows) relative to total acini in the SGs. k) Representative images of Prussian blue staining showing iron deposits (black arrows) within the SGs and quantification of the stained area. A total of three mice from each group were used for histological analysis. The number of biological replicates for WB and qPCR analysis corresponds to the number of dots on the graph. In (f) and (j), F‐actin staining was performed to indicate the epithelial structure of the SG. Scale bars = 40 µm (f, j) and 1 mm (k). Data are shown as the mean ± SEM and compared by unpaired t‐test. *P < 0.05, **P < 0.01, ***P < 0.001.
