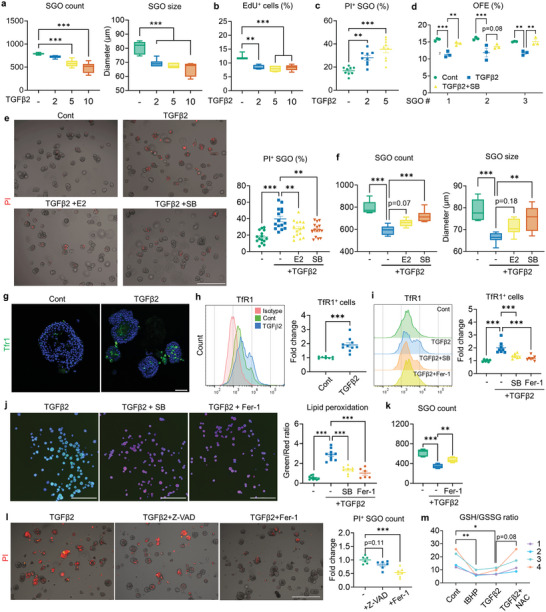
Figure 4.

TGFβ2 impairs the growth and viability of SGOs by inducing ferroptosis. a–c) TGFβ2 treatment, initiated on day 4 and analyzed at day 7, resulted in a dose‐dependent decrease in the total count and size of SGOs (a), reduced the EdU incorporation ratio (b), and increased the number of PI+ SGOs (c). d) SB (10 µm) counteracts the negative impact of TGFβ2 (5 ng mL−1) on the OFE of SGOs. e,f) Co‐treatment with E2 or SB mitigated the TGFβ2 impact on SGOs, reducing cell death (e) and increasing the total organoid count and size in TGFβ2‐treated SGOs (f). g,h) Expression patterns of TfR1 in Cont‐ and TGFβ2‐treated SGOs were determined by immunostaining (g) and flow cytometry (h). i,j) Baseline ferroptosis in SGOs was estimated by TFR1 detection via flow cytometry (i) and lipid peroxidation assay (j). Induction of ferroptosis in TGFβ2‐treated organoids was impeded by SB and Fer‐1 (1 nM). k) Recovery of TGFβ2‐mediated reduction in SGO count with Fer‐1 co‐treatment. l) Viability of TGFβ2‐treated SGOs exposed to either Z‐VAD (10 µm) or Fer‐1 assessed by PI staining. Quantification analysis highlights the dominance of ferroptosis over apoptosis in TGFβ2‐induced SGO damage. m) Reduced‐ and oxidized GSH levels in SGOs were evaluated after 24 h of TGFβ2 treatment. tBHP was used to induce oxidative stress, while antioxidant NAC was co‐treated with TGFβ2 to recover GSH depletion. At least three lines of SGOs were used for all experiments. For (g) and (i), Hoechst staining was conducted to visualize each organoid for analysis. Scale bars = 500 µm (e, l), 40 µm (g) and 1 mm (j). Data are shown as the mean ± SEM and compared by one‐way ANOVA with Dunnett`s multiple comparisons test. *P < 0.05, **P < 0.01, ***P < 0.001.
