Figure 8.

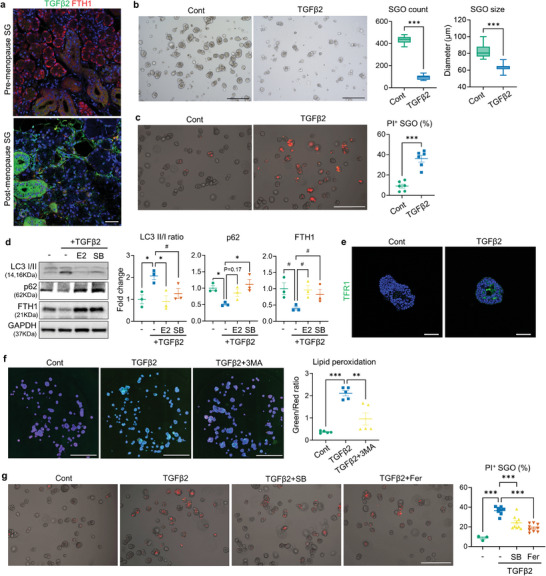
Validation of the detrimental impact of TGFβ2 on human SG epithelium using tissue samples and organoids (hSGOs). a) Representative immunofluorescence images showing TGFβ2 and FTH1 expression patterns in SG sections derived from pre‐ and postmenopausal women. b,c) TGFβ2 treatment was applied to hSGO cultures on day 4. Both the growth (b) and viability (c) of hSGOs were impaired by TGFβ2. d) Immunoblot analysis focusing on autophagy proteins and FTH1 was performed on hSGOs in the presence of indicated chemicals. e) Immunofluorescent images showing TFR1 expression in Cont‐ and TGFβ2‐treated hSGOs. f) 3MA treatment reduced the lipid peroxidation levels in TGFβ2‐treated hSGOs. g) Quantification of PI+ hSGOs indicating the protective effect of SB and Fer‐1 against TGFβ2‐mediated cell death. In (f), Hoechst staining was conducted to visualize each organoid for the analysis. Scale bar = 40 µm (a, e), 500 µm (b, c, g) and 1 mm (f). Data are shown as the mean ± SEM and compared by unpaired t‐test (b, c) or one‐way ANOVA with Dunnett`s multiple comparisons test (d, f, g). **P < 0.01, ***P < 0.001.
