Figure 6.

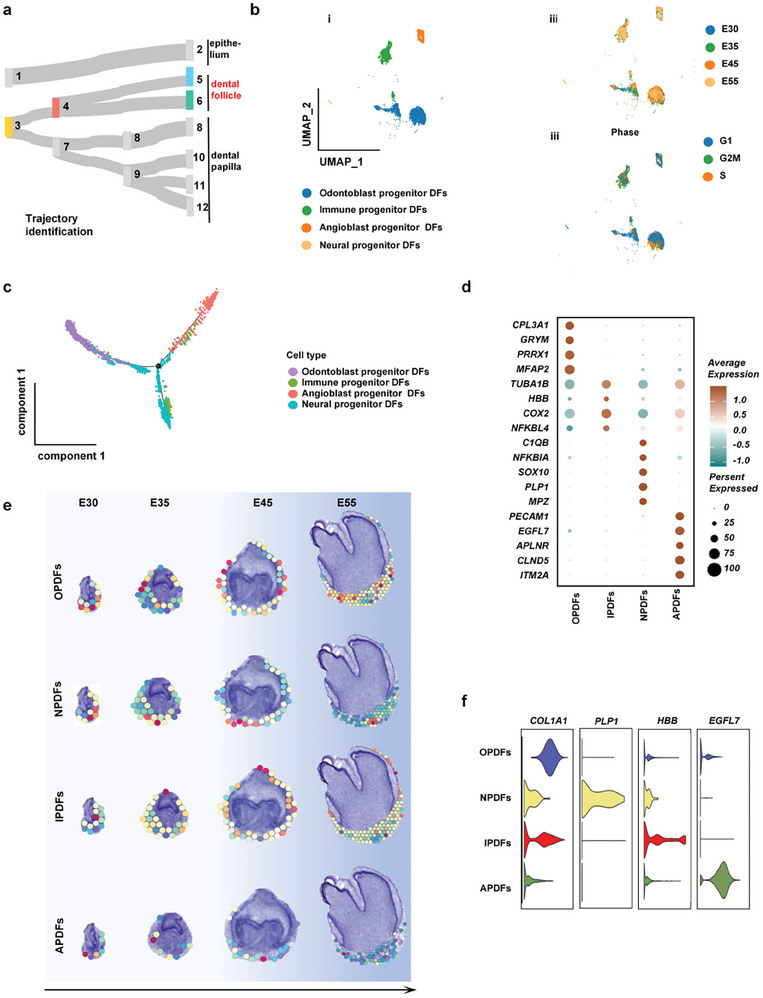
Cataloging in dental follicle development. a) The developmental connections of dental follicle domains. b) UMAP plot visualizing dental follicle cell clusters (i) and the follicle cell distribution based on the developmental time course (ii) and cell cycle stage (iii). c) Pseudotemporal cell ordering visualizes the developmental course of dental follicle clusters. d) Dot plot representing markers of specific dental follicle clusters. Points were scaled by the percentage of cells expressing the gene within the clusters, colored by average expression level. e) Conjoint analysis of single cell and spatial transcriptome sequencing representing the spatial distribution characteristics of dental follicle clusters. f) Violin plots presenting the expression level of selected markers closely related to osteogenesis, neurogenesis, angiogenesis, and immunogenicity functions. h) UMAP plot representing four spatial clusters of follicle clusters based on functional cluster status.
