
Figure 1.
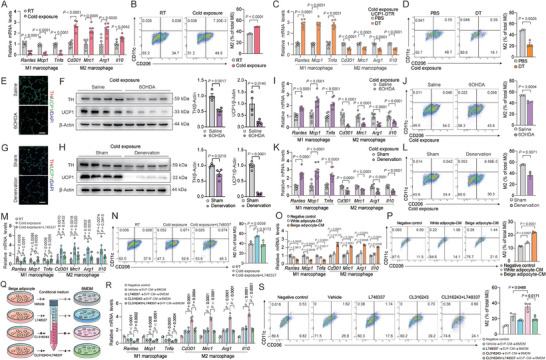
Thermogenic adipocytes promote M2 macropage polarization in adipose tissue. A) Representative M1 and M2 macrophage marker gene expression (n = 6) and B) flow cytometric plots and quantification demonstrate the numbers of M2 macrophages (CD206+/CD11c−) (n = 3) in scWAT from C57BL/6 mice under room temperature (25 °C) or cold exposure (4 °C) for 2 d; C) representative M1 and M2 macrophage marker gene expression (n = 6) and D) flow cytometric plots and quantification demonstrate the numbers of M2 macrophages (CD206+/CD11c−) (n = 3) in scWAT from UCP1‐DTR mice injected with DT (200 ng/mice/d) or PBS; E,G) representative TH and UCP1 immunostaining in scWAT, F,H) UCP1 and TH protein expression, I,K) M1 and M2 macrophage marker gene expression (n = 8), and J,L) representative flow cytometric plots and quantification demonstrate the numbers of M2 macrophages (CD206+/CD11C−) (n = 3) in scWAT of mice with 6‐OHDA injection (E, F, I, and J) or surgical transection of sympathetic neuron fibers (G, H, K, and L) under cold exposure for 2 d. Scale bar, 50 µm; M) representative M1 and M2 macrophage marker gene expression (n = 6) and N) flow cytometric plots and quantification demonstrate the numbers of M2 macrophages (CD206+/CD11c−) (n = 3) in scWAT of mice locally injected with ADRB3 selective antagonist L748337 (5 mg kg−1) or PBS under cold exposure; O) representative M1 and M2 macrophage marker gene expression (n = 4) and P) flow cytometric plots and quantification demonstrate the numbers of M2 macrophages (CD206+/CD11c−) (n = 3) in BMDMs stimulated with conditioned medium (CM) of white adipocyte or beige adipocyte for 48 h; Q) scheme illustrating experimental setup; R) representative M1 and M2 macrophage marker gene expression (n = 4) and S) flow cytometric plots and quantification demonstrate the numbers of M2 macrophages (CD206+/CD11c−) (n = 3) in BMDMs stimulated with CM from unstimulated beige adipocytes (vehicle) or CL316243, L748337, CL316243+L748337 treated beige adipocytes for 48 h. Data were expressed as means ± SEM. (A)–(D), (F), and (H)–(L) were calculated by unpaired two‐tailed Student's t‐test; (M)–(S) were calculated by two‐way ANOVA followed with Bonferroni's multiple comparison test.