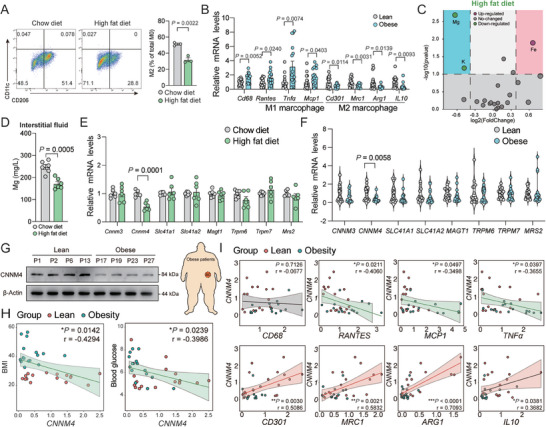
Figure 5.

CNNM4 expression is associated with obesity. A) Representative flow cytometric plots and quantification demonstrate the numbers of M2 macrophages (CD206+/CD11c−) in scWAT of mice fed with HFD or regular diet (RD) for 12 weeks (n = 3); B) representative M1 and M2 macrophage marker gene expression in scWAT from lean and obese human individuals (16 vs 16); C) volcano plot of ions altered in scWAT‐derived interstitial fluid from HFD or RD‐fed mice (n = 4); D) Mg levels in scWAT‐derived interstitial fluid from HFD or RD‐fed mice (n = 6); E) representative Mg transporters (Mrs2, Cnnm4, Cnnm3, Slc41a1, Slc41a2, Magt1, Trpm6, and Trpm7) gene expression in scWAT from HFD or RD‐fed mice (n = 6) or F) lean and obese human individuals (16 vs 16); G) representative CNNM4 and UCP1 protein expression in scWAT from lean and obese human individuals; H) the correlation between BMI and blood glucose, I) representative M1 and M2 macrophage marker gene expression (CD68, RANTES, MCP1, TNFα, CD301, MRC1, ARG1, and IL10) with CNNM4 expression in lean and obese human individuals (n = 32). Data were expressed as means ± SEM. (A), (B), and (D)–(F) were calculated by unpaired two‐tailed Student's t‐test or (H) and (I) were analyzed by Pearson correlation analysis.
