
Figure 1.
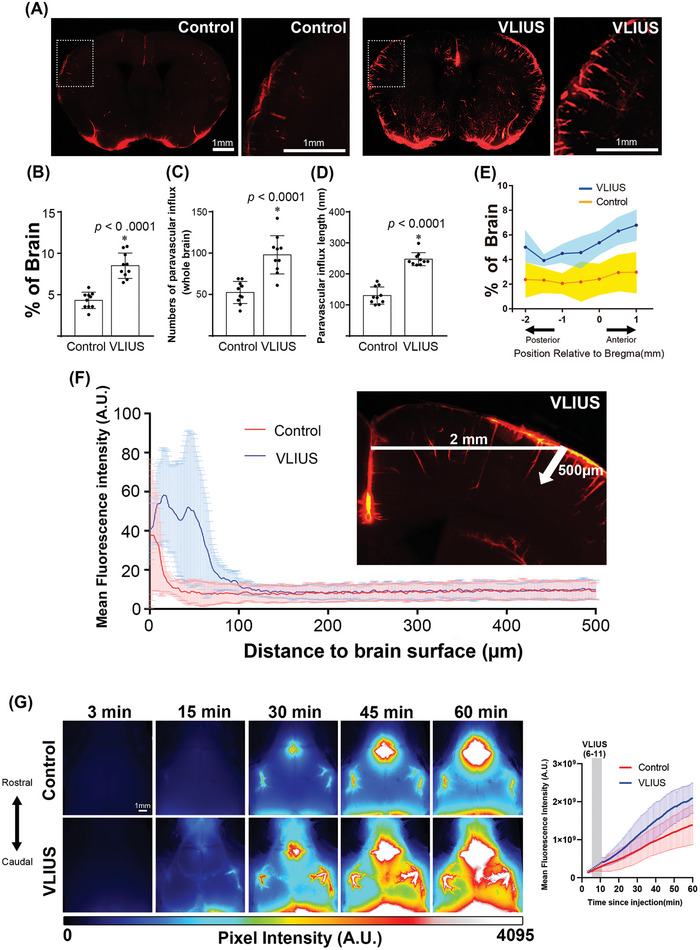
VLIUS stimulation increases CSF tracer influx. A) Representative images of coronal brain sections +0 mm from the bregma showing an increase in CSF tracer penetrance in response to very low‐intensity ultrasound (VLIUS) compared to controls. Scale bar: 1 mm. Quantification of the influx area B), influx numbers C), and influx length D) of VLIUS stimulation compared to controls: dots represent individual mice in each group. n = 10 mice/group; two independent repeats of n = 5 mice per group; E) Positional slice‐by‐slice representation of the area covered by tracer influx in coronal brain slices relative to the bregma. The solid line represents the percentage of the average tracer influx of all brain slices at that section per condition (shaded area = ±STDEV). n = 10 mice/group; two independent repeats of n = 5 mice per group F) Tracer penetration depth is measured at the cortical position 2 mm lateral to the midline, from the pial surface to a depth of 500 µm in the coronal section. Quantification of the mean fluorescence intensity of the tracer indicates that VLIUS stimulation induces greater penetration of the tracer deep into the brain (n = 5, respectively). G) Representative time‐lapse images of CSF influx over the first 60 min immediately following tracer injection in control and VLIUS‐stimulated mice. Images (16‐bit pixel depth) are color coded (royal form ImageJ) to depict pixel intensity (PI) in arbitrary units (AU). CSF, cerebrospinal fluid; VLIUS, very low intensity ultrasound. Scale bar: 1 mm. The results, for which the data are presented as mean ± SD (error bars denote SD), shown in Figure 1 (B, C, D) were analyzed using an independent t‐test to assess between‐group differences. An asterisk indicates p < 0.05.