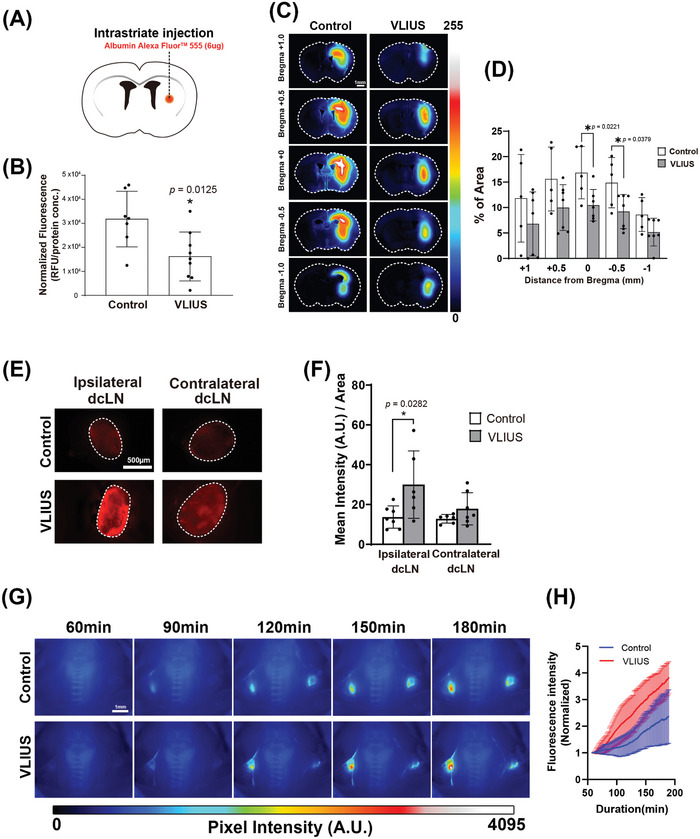
Figure 2.

Increased interstitial fluid clearance observed through VLIUS stimulation. A) Schematic of the experiment. B) Three hours after injection, the remaining tracer is significantly lower in very low‐intensity ultrasound (VLIUS)‐stimulated mouse brains compared with controls (p = 0.0125, control group n = 7, VLIUS group n = 9), indicating that the clearance rate may be higher under VLIUS stimulation. Representative images C) and quantification of tracer area percentage D) in the coronal brain sections at different distances from the bregma reveal a reduction in the remaining tracer within the brain parenchyma in response to VLIUS compared to the control group. Scale bar: 1 mm. Representative images E) and quantification of tracer intensity F) of deep cervical lymph nodes (dcLN) three hours post‐intraparenchymal tracer injection showing a statistically significant increase in tracer intensity in the VLIUS group, indicating that the clearance rate may be higher under VLIUS stimulation. Scale bar: 500 µm. Representative time‐lapse images G) and quantification of tracer intensity H) from 60 to 180 min following tracer injection revealed a faster and higher increase in dcLN tracer intensity in the VLIUS group. Images (16‐bit pixel depth) are color coded (royal form ImageJ) to depict pixel intensity (PI) in arbitrary units (AU). Scale bar: 1 mm. The results, for which the data are presented as mean ± SD (error bars denote SD), shown in Figure 2 (B, D) and 2 (F) were analyzed using an independent t‐test and ANOVA followed by Tukey's post‐hoc test, to assess between‐group differences. An asterisk indicates p < 0.05.
