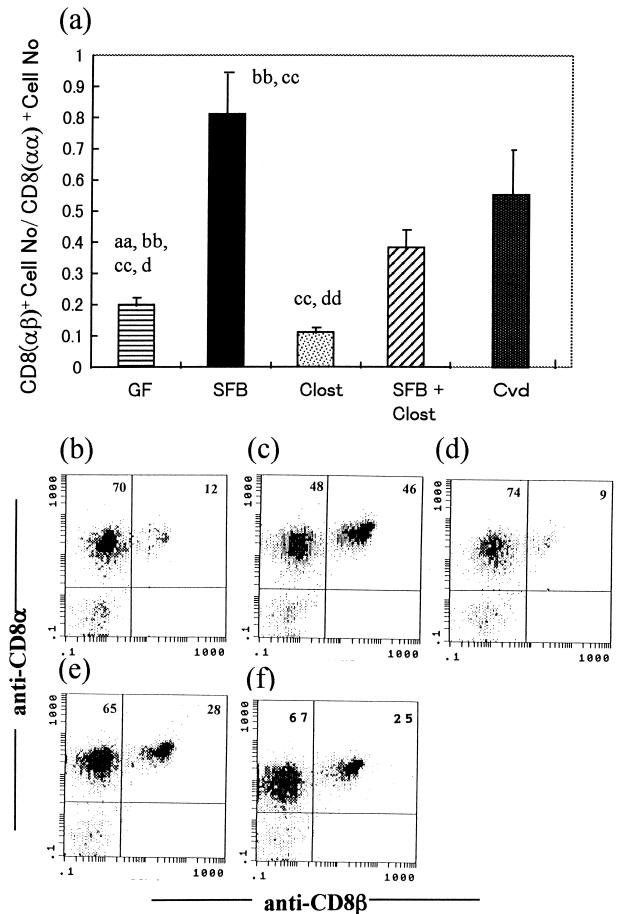
FIG. 3.
Ratios of the number of CD8αβ-bearing αβIEL to that of CD8αα-bearing αβIEL in GF mice, SFB-mice, Clost-mice, mice associated with both SFB and clostridia (SFB + Clost), and Cvd mice. The data in panel a are means plus standard deviations (n = 3 or 4) and were reproducible in the experiment involving the first generation. The letters a, b, c, and d near the columns indicate statistically significantly differences from the SFB, Clost, SFB + Clost, and Cvd groups, respectively. Single letter, P < 0.05; double letters, P < 0.01. (b to f) Representative data for the quadrants on three-color analysis gating of αβIEL in the GF (b), SFB (c), Clost (d), SFB + Clost (e), and Cvd (f) groups.

