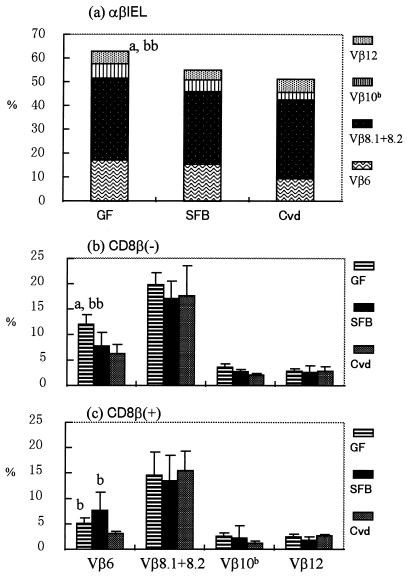
FIG. 4.
Vβ usage in GF mice, SFB-mice, and Cvd mice. (a) Data showing the sum of Vβ6+, Vβ8.1+8.2+, Vβ10b+, and Vβ12+ cells in each group. (b and c) Vβ6+, Vβ8.1+8.2+, Vβ10b+, and Vβ12+ cells in CD8β− (b) and CD8β+ (c) subsets determined by three-color analysis of GF mice, SFB-mice, and Cvd mice. The data are means plus standard deviations (n = 4 to 7). The letters a and b near the columns indicate statistically significant differences from the SFB and Cvd groups, respectively. Single letter, P < 0.05; double letters, P < 0.01.

