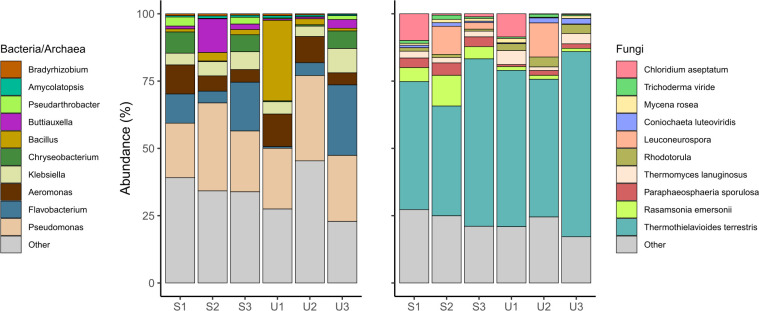
Fig 1.
Abundance of genera within the woodchip bioreactor. The figure shows the 10 most abundant genera of bacteria/archaea (left) and fungi (right). The sample names refer to triplicates of surface (S) or underwater (U) samples in the WBR. More information about the ASVs and OTUs can be found in Table S1 and S2, respectively.

