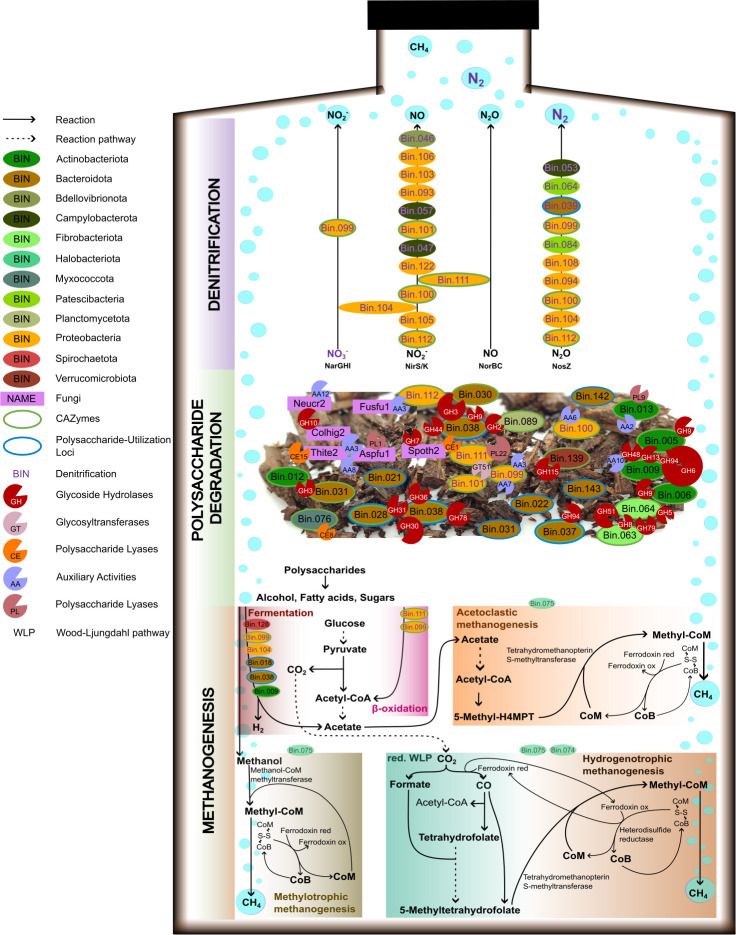
Fig 4.
An overview of the most prominent metabolic processes in the enrichment cultures. The displayed metabolism of the microbiome is inferred using detected proteins from metaproteomics analysis and the measured headspace gases during the 7-month enrichment period. No proteins could be detected for the two archaea (Bin.074, Bin 075); however, CH4 production could be measured by GC suggesting that these populations were active despite being below metaproteomics detection levels. Hence, the displayed pathways for methanogenesis are inferred from metagenomics and thus indicated with a dimmed bin color. Abbreviations: Aspfu1—Aspergillus fumigatus, Colhig2—Colletotrichum higginsianum, Fusfu1—Fusarium fujikuroi, Mycpur1—Mycena pura, Neucr2—Neurospora crassa, Spoth2—Thermothelomyces thermophilus, Thite2—Thermothielavioides terrestris. More information about the N-reductases for the listed MAGs is available in Fig. S3.

