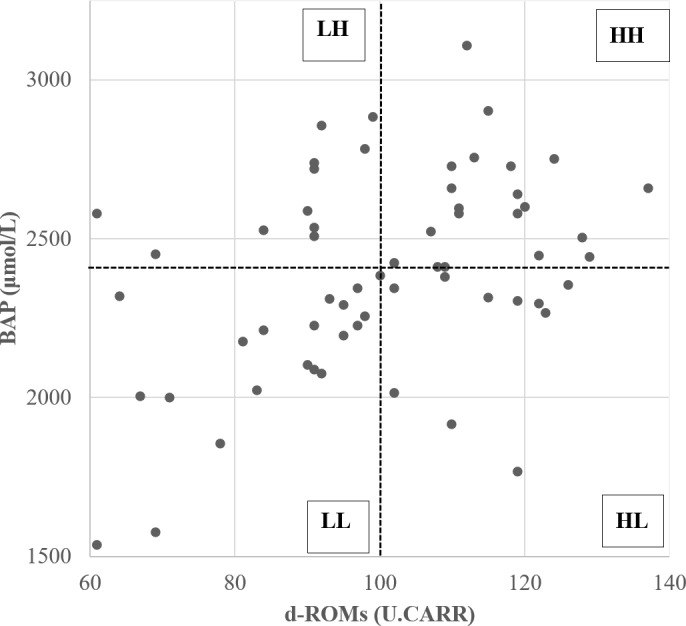
Figure 1.

Scatterplot of diacron-reactive oxygen metabolite (d-ROM) and biological antioxidant potential (BAP) values before the start of superovulation treatment. Dotted lines represent the median d-ROMs and BAP values. The abbreviations used in the figure are as follows: LH – low d-ROM and high BAP values; HH – high d-ROM and high BAP values; HL – high d-ROM and low BAP values; and LL – low d-ROM and BAP values.
