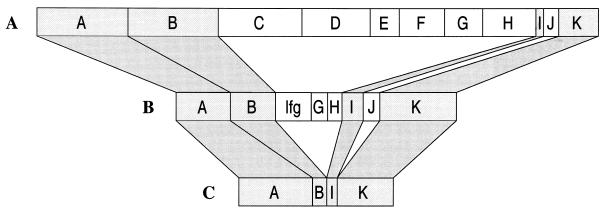
FIG. 1.
The frequency distribution of major ospC groups among B. burgdorferi isolates from eastern Long Island Ixodes scapularis ticks (n = 72) (A), erythema migrans lesions (n = 118) (B), and secondary sites of infection (n = 44) (C). The percentage of group A plus K was 23% in the tick isolates, 47% in the skin isolates, and 84% in the secondary sites. The lengths of the bars in the figure reflect these differences by holding the length of the combined A and K groups constant. In the skin, groups C, D, E, M, N, O, T, and U have been combined since their individual frequencies are 0.025 or less. This combination of groups has been labeled lfg for low-frequency groups. When combined, these groups make up 12.7% of the total number of strains.

