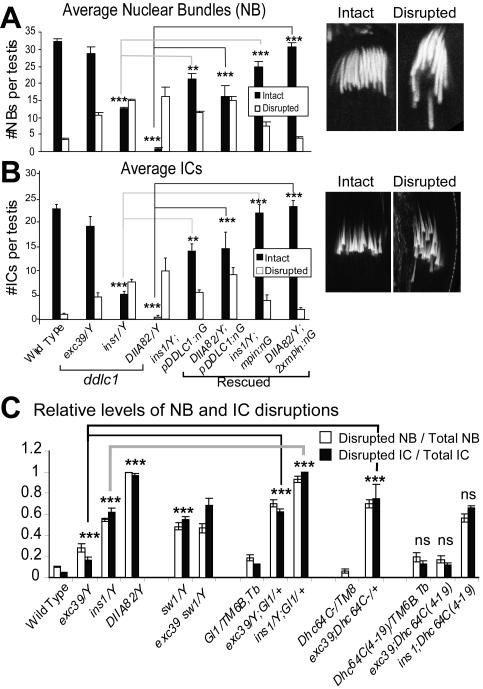
Figure 3.
NB and IC organization defects in ddlc1 testes. (A and B) Average intact (solid bars) and disrupted (open bars) nuclear (A) and F-actin cone (B) bundles in wild-type and mutant testes. exc39, ins1, and DIIA82 represent weak, moderate, and strong alleles of ddlc1. pDDLC1:nG and mPIN:nG indicates the presence of UAS-DDLC1/+; nosGal4-VP16/+ and UAS-Myc-PIN/+; nosGal4-VP16/+, respectively, in the backgrounds. N = 8 or more for each set of plots; error bars, ±SEM. Statistical significance is tested with respect to the Canton S values as control for the ddlc1 mutants and appropriate ddlc1 allele for the rescue data as indicated by link lines between the bars. Extremely significant (p < 0.0001), very significant (p < 0.001) and significant (p < 0.01) differences are indicated by ***, **, and *, respectively, at the top of the bar. Typical examples of an intact and a disrupted NBs (A) and ICs (B) are shown at the right margins of the respective plots. (C) Relative levels of NB and IC disruptions in various genetic combinations with ddlc1 alleles are calculated by the ratio of disrupted to total population for each testis and plotted. N equals 8 or more for each data point and the error bars indicates ±SEM. For double mutant combinations, significance values were calculated with respect to each of the single mutant values (see Supplementary Table 1 for details).

