Figure 5.
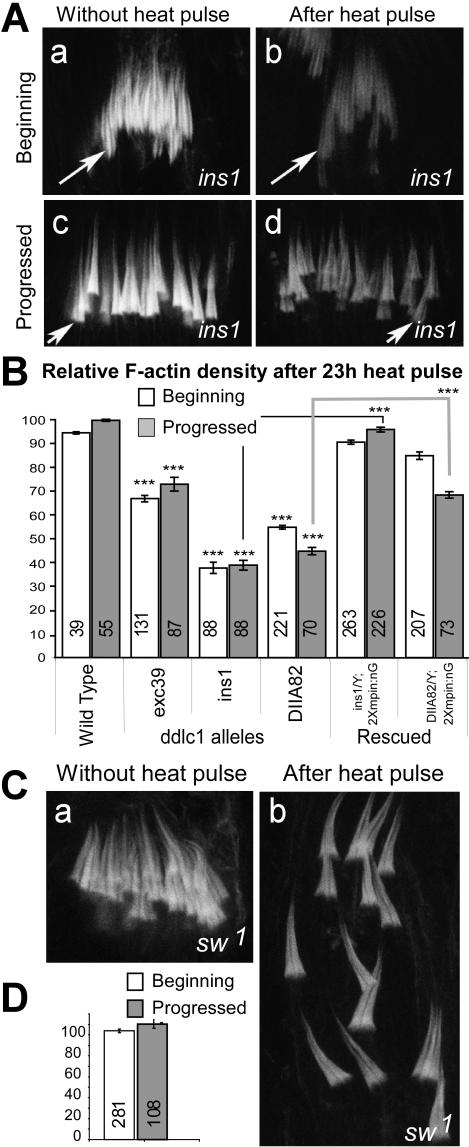
Analysis of ddlc1 function during F-actin cone assembly. (A) RITC:phalloidin staining at the ICs from ddlc1ins1 testes grown continually at 18°C and after a 23-h pulse at 29°C. (B) Relative F-actin density at the wild-type and ddlc1 hemizygous cones after a 23-h pulse, calculated with respect to the average control values as per the descriptions provided in Materials and Methods. N-values are indicated on each bar; error bars, ±SEM. Significance of the mutant values are tested with respect to the wild-type and for the rescued data it was compared with the corresponding mutants as indicated by the link lines. (C) RITC:phalloidin staining in the ICs from sw1 testes before and after heat pulse. ICs were disrupted after the heat pulse but the staining levels remained unaltered. (D) Relative F-actin density after heat pulse in the sw1 alleles as described above.

