Figure 6.
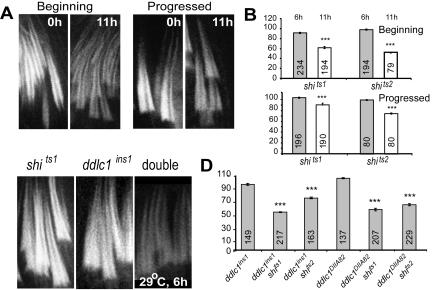
F-actin density at the investment cones is synergistically reduced in the shi ddlc1 double mutants after a 6-h heat pulse. (A) RITC:phalloidin staining at the F-actin cones from shits1 hemizygous testis, before and after an 11-h heat pulse. (B) Gray and open bars indicate relative F-actin levels at the investment cones after a 6- and an 11-h heat pulse, respectively, from shits1 and shits2 hemizygous testes. N values are indicated on each bar; error bars, ±SEM. (C) F-actin cones from shits1 ddlc1ins1 and ddlc1ins1 shits1 double mutant testes after a 6-h heat pulse. (D) Relative F-actin levels after a 6-h heat pulse in different mutant combinations. The data are presented for the progressed cones to highlight the synergistic level of the interaction.

