Figure 1.
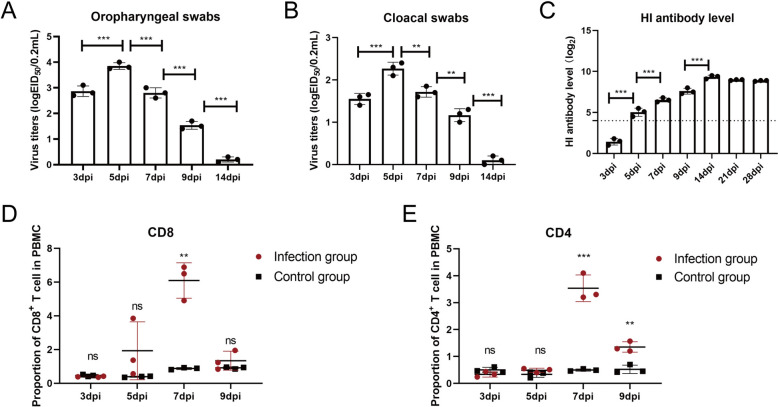
Monitoring of H5N1 AIV shedding, HI Ab levels, and T lymphocyte percentages post-infection. Virus (H5N1 AIV) shedding was monitored via detection of the viral load in oropharyngeal (A) and cloacal (B) swabs. Statistical analyses of the virus titre in swabs at various time points were performed using one-way ANOVA. C HI Ab levels were monitored in 1% chicken RBCs. A value > 4 (dotted line) was considered HI Ab positive. One-way ANOVA was used for statistical comparisons. The percentages of CD8+ T cells (D) and CD4+ T cells (E) in the control group and infection group at various time points were detected. The cells (2 × 10⁵) from each sample were collected for flow cytometric analysis. The results are presented as the means ± SEMs, and the unpaired t test was used for statistical comparison. H5N1 virus shedding and H5N1 HI Ab expression in the control group were negative at various time points (data not shown). Three ducks in the infected and control groups were randomly selected for sampling and detection. *P < 0.05, **P < 0.01, ***P < 0.001. ns, not significant.

