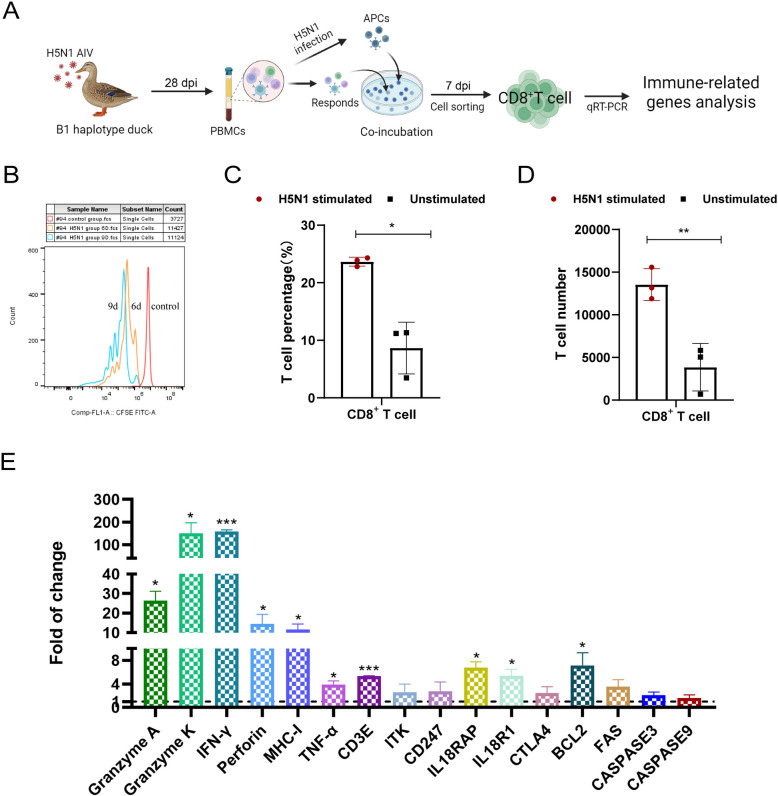
Figure 3.
In vitro culture and response of H5N1 AIV-stimulated CD8+T cells from B1-line ducks. A Diagram of in vitro culture and response detection of H5N1 avian influenza virus-specific duck CD8+ T cells. B Flow cytometry detection of the proliferation of CFSE-labelled PBMCs stimulated with H5N1 AIV. The red sample indicates CFSE-labelled memory PBMCs without stimulation. The orange and blue samples represent CFSE-labelled PBMCs cultured for 6 and 9 days after H5N1 AIV stimulation, respectively. The percentage of CD8+ T cells (C) and the number of CD8+ T cells (D) in H5N1-stimulated and unstimulated cells after 7 days of culture. CD8+ T-cell percentage or number data were collected from three replicates in two independent experiments. The results are presented as the means ± SEM, and the unpaired t test was used for statistical comparison. E Changes in the transcription of H5N1 AIV-specific CD8+ T cells were detected via qRT-PCR. CD8+ T cells were sorted from H5N1-stimulated and unstimulated PBMCs after 7 days of culture. The data were collected from three biological samples in triplicate from each H5N1-stimulated and unstimulated group. The results are presented as the means ± SEM, and paired t tests were used for statistical comparisons. *P < 0.05, **P < 0.01, ***P < 0.001.

