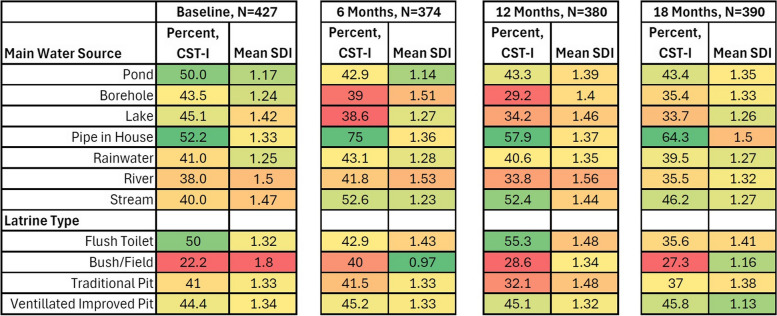
Fig. 1.
Distribution of vaginal community state type and shannon diversity index by water source and latrine type over time. Legend: Color shading and intensity represent proportions of optimal community state type-I (CST-I; L. crispatus dominant) and Shannon diversity index (SDI) by category of water source and latrine type. A lower proportion of observations CST-I and higher Shannon diversity index are represented with red shades, and a higher proportion of CST-I and lower Shannon diversity index are represented with green shades, with medium values transitioning through yellow. Thus, for example, participants with piped water in the home consistently have the highest proportion of observations with CST-I, while those relying on bush/field for latrine type consistently have the lowest proportion of observations with CST-I. Alpha diversity, as represented here by Shannon diversity index, is less consistent over visits

