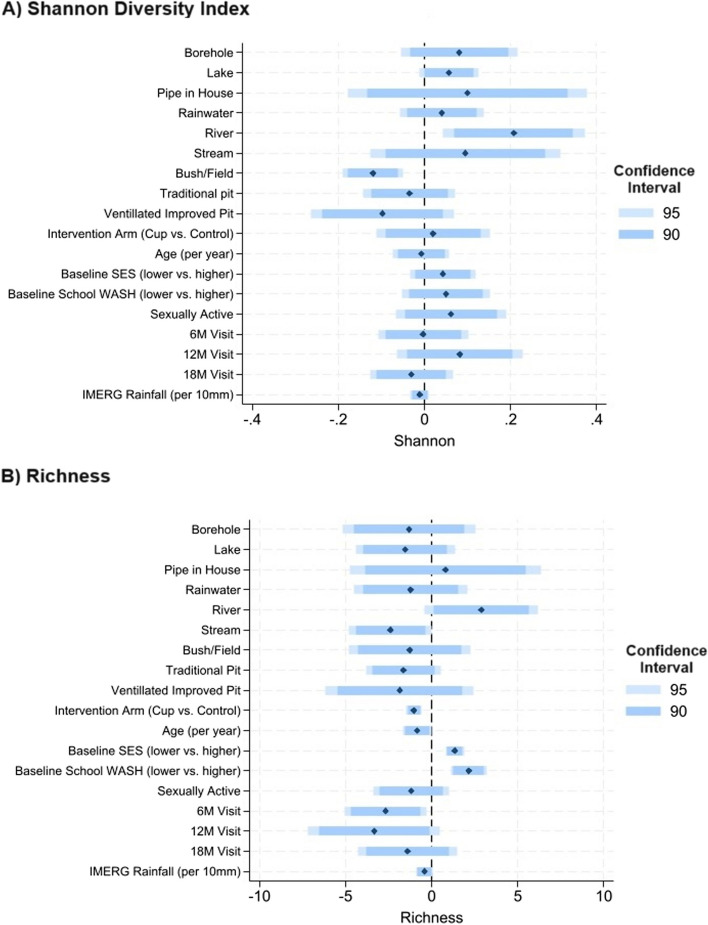
Fig. 2.
Results of multivariable alpha diversity analyses. Legend: The results of multivariable mixed effects linear regression are summarized in the plots above for alpha diversity measures: (A) Shannon diversity index and (B) Richness. Coefficients are represented with black diamonds, and 95% and 90% Confidence Intervals (CI) in blue bars, as shown in the legend. Models are simultaneously adjusted for all variables presented. For water sources, the reference is “pond” and for latrine type the reference is “flush toilet”

