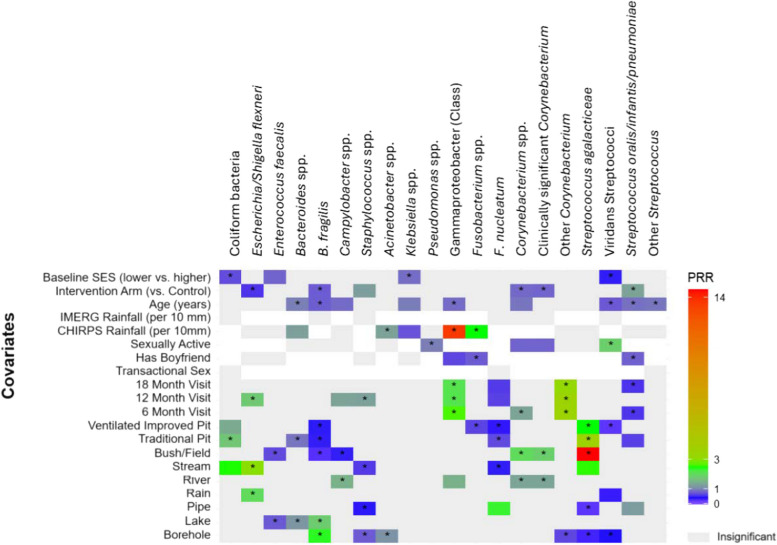
Fig. 3.
Results of mixed effects multivariable poisson regression: targeted taxa association with water source and latrine type. Legend: Heatmap summarizing prevalence rate ratios (PRRs) for the associations between water source, latrine type, and other covariates in relation to the targeted taxa. The heatmap represents the direction and magnitude of the PRR for the covariates. PRRs < 1 (i.e., inverse relationship) are shaded in blue, and positive PRRs (> 1) are shaded in green to red, with deeper intensity representing the magnitude of the association. Covariate associations with p-value < 0.10 are shown in color, and those with p-value < 0.05 are indicated with an asterisk (*). Covariates associations that are not significant but maintained in the model for fit are shown in light grey. White space indicates the variable is not included in the model. For water sources, the reference is “pond” and for latrine type the reference is “flush toilet”

