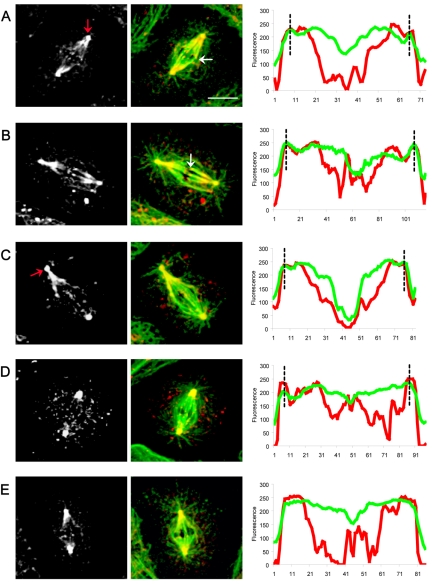
Figure 8.
Localization and linescan quantitation of KLP10A in control S2 cell spindles. KLP10A localizes at the centrosomes, spindle poles (A–E white-gray; red arrows) and on the kinetochores (white arrows). Bar, 10 μm. Corresponding linescans of fluorescence intensity (tubulin, green; KLP10A, red) along the pole-to-pole axis of spindles from A to E show KLP10A staining at centrosomes (black dotted lines), and the peaks in the central region of the spindle correspond to KLP10A on the kinetochores.

