Figure 4.

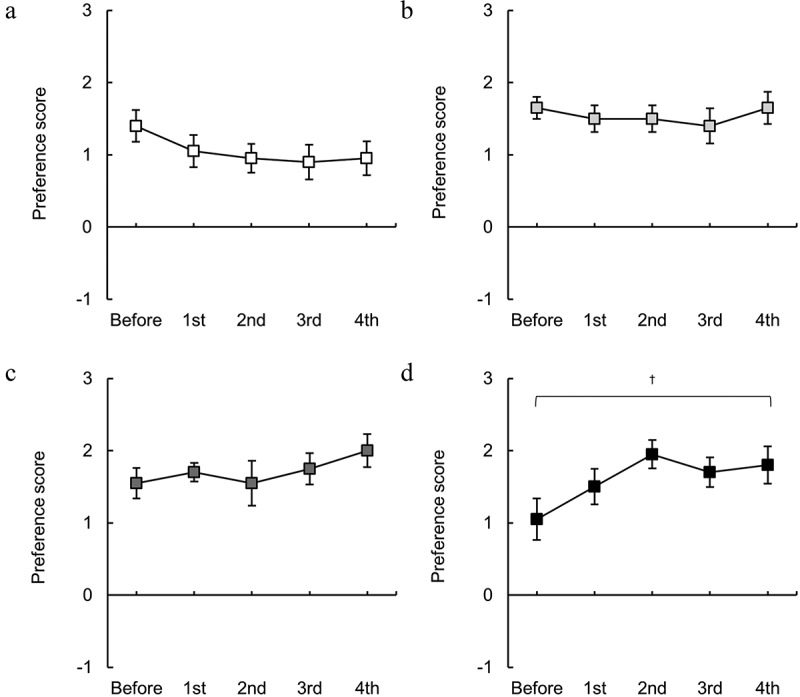
Changes in the taste preference of isotonic beverages induced by exercise. The preference scores for (a) ×0.5, (b) ×0.75, (c) ×1, and (d) ×1.25 solutions. † indicates p < 0.05 (Friedman test). n = 20.

Changes in the taste preference of isotonic beverages induced by exercise. The preference scores for (a) ×0.5, (b) ×0.75, (c) ×1, and (d) ×1.25 solutions. † indicates p < 0.05 (Friedman test). n = 20.